You built a solid quarterly plan. Three OKRs, clear Key Results, priority weights assigned. You felt genuinely good about it focused, realistic, ready.
Then week two arrived. A client escalation ate Monday. Three unplanned calls consumed Wednesday. Friday was damage control. The week you planned and the week you lived looked nothing alike.
By week six, you were two KRs behind and silently negotiating with yourself about which goals were “still achievable” and which ones you’d quietly move to next quarter.
Sound familiar?
This isn’t a planning failure. It’s a capacity failure. You built an ambitious plan without first calculating how many strategic hours you actually have available to execute it. The plan was real. The time budget behind it wasn’t. AI capacity planning fixes this math problem before you commit.
AI capacity planning fixes this before the quarter starts, not six weeks in. Using the 12-week framework, you calculate your net strategic capacity, identify capacity drains, and size your OKRs to match reality. This is the third critical piece of a complete AI strategic planning system. For the full quarterly framework including OKR creation, priority allocation, and review cycles, see: AI Strategic Planning for Entrepreneurs : Turn quarterly goals into real progress
Or dive straight into the capacity formula below.
Table of Contents
Why does AI Capacity planning prevent quarterly overcommitment?
Why Entrepreneurs systematically overcommit every quarter (and Why AI Can Spot It)
Overcommitment isn’t a character flaw. It’s a cognitive one specifically, what psychologists call planning optimism bias: the tendency to estimate how long tasks will take based on best-case scenarios rather than realistic ones.
Daniel Kahneman documented this pattern extensively. When people plan, they imagine a smooth version of the future no interruptions, no unexpected problems, full energy and focus throughout. The actual future, predictably, looks nothing like that.
For US entrepreneurs, this bias gets amplified by cultural pressure. The hustle narrative the idea that ambitious people find a way to get it all done makes it feel almost virtuous to overcommit. If you’re not stretching, you’re not trying hard enough.
The result: founders consistently set quarterly goals that would require 20% more hours than they actually have. They’re not lazy. They’re planning for a version of themselves that doesn’t exist the one with no Slack messages, no client fires, no life outside the business.
Capacity planning replaces that fantasy with arithmetic. And arithmetic, it turns out, is a much better planning partner.
The 5 Hidden capacity drains AI helps you finally quantify
Before you can calculate how many hours you have, you need to understand how many hours you’re silently losing every week.
Most founders dramatically underestimate their capacity drains the recurring time costs that don’t show up on the strategic plan but consume the week anyway.
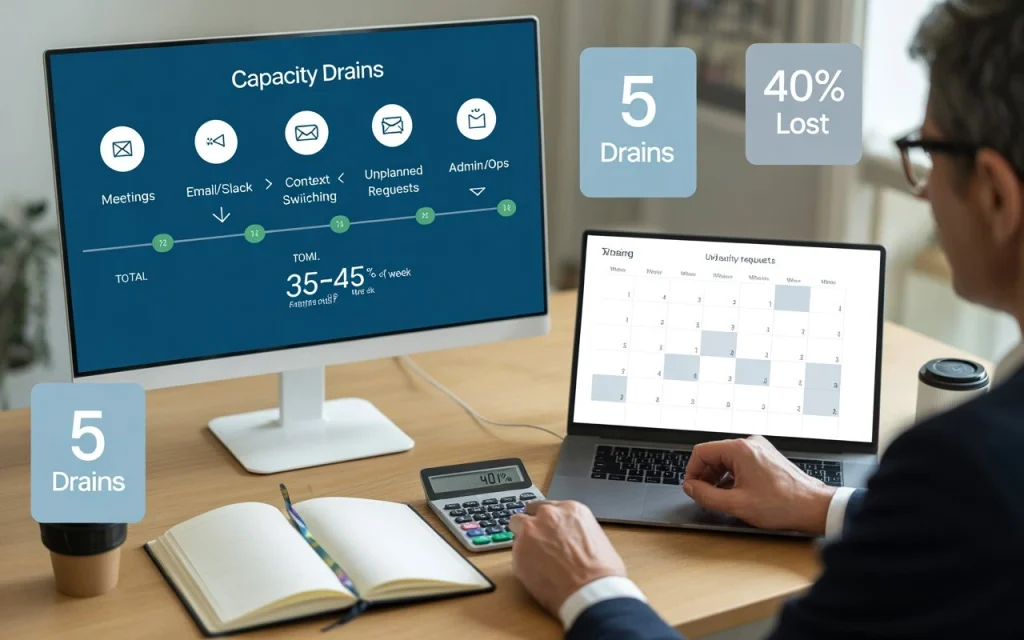
Drain 1 Meetings and calls. Even if you’ve optimized your meeting culture, client calls, team check-ins, and vendor conversations likely consume 6–12 hours weekly for most solopreneurs and small team founders. If you haven’t measured this recently, you’re probably underestimating it.
Drain 2 Email and async communication. Slack, email, DMs, comments. Research from RescueTime found that the average knowledge worker spends 2.5 hours per day on communication tools. For founders, that number often runs higher during growth phases.
Drain 3 Context switching. Every time you shift from strategic work to reactive work and back, you lose 15–23 minutes of productive ramp-up time (University of California, Irvine). If you’re switching modes 8 times a day, you’re losing nearly 3 hours to transition costs alone.
Drain 4 Unplanned requests. Client escalations, team questions, unexpected partner issues, technical problems. These feel unpredictable, but their aggregate volume is remarkably consistent week over week. If fires consumed 4 hours last quarter, budget 4 hours this quarter.
Drain 5 Admin and operations. Invoicing, bookkeeping, tool management, legal reviews, hiring tasks. Founders routinely forget to count this until it’s eating their Thursday afternoon.
Added together, these five drains typically consume 35–45% of a founder’s available weekly hours before a single strategic task gets touched.
That’s not a problem you can hustle your way out of. It’s a math problem. And math has a solution.
How does the 12-Week AI Capacity formula calculate net strategic capacity?
The 12-Week AI capacity formula: From gross hours to net strategic time
Here’s the formula. It’s not complicated but most founders have never run these numbers explicitly.
Step 1 Calculate your gross available hours. How many hours per week are you genuinely available to work? Not aspirationally realistically. Include the fact that you have a life, that some weeks are short, that energy isn’t constant.
For a solopreneur working a serious but sustainable schedule: typically 40–50 hours/week.
Multiply by 12 weeks. That’s your gross quarterly capacity.
Example: 45 hours/week × 12 weeks = 540 gross hours
Step 2 Subtract your baseline drains. Based on the drain categories above, estimate your weekly drain total. Be honest. If you know meetings consume 8 hours and email eats another 2 hours daily, that’s already 18 hours gone before you open a project file.
A reasonable starting estimate for most founders: 40% drain rate.
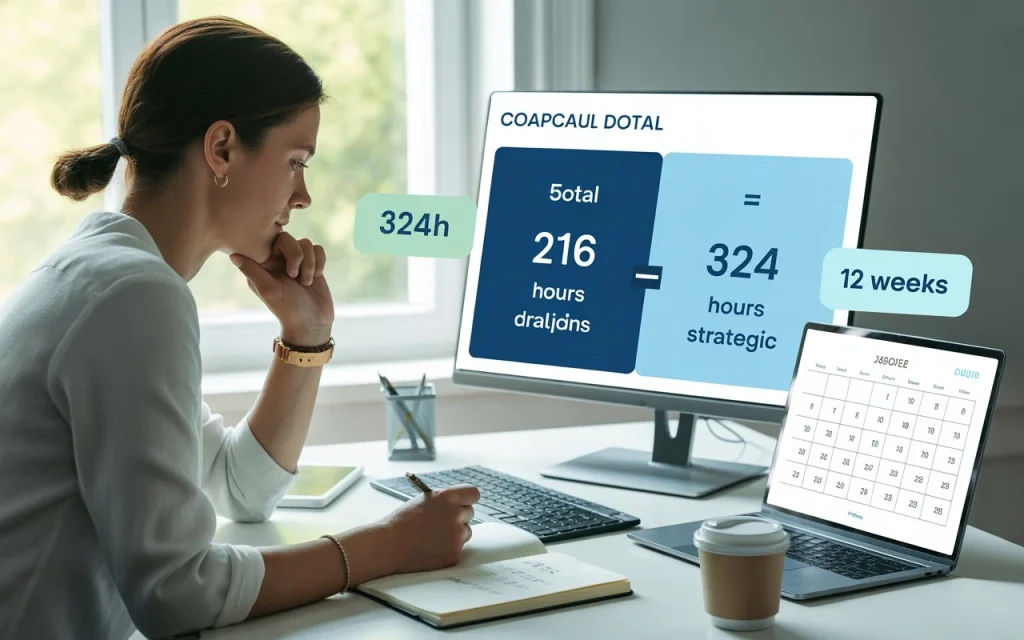
Example: 540 hours × 40% drain = 216 hours lost to drains
Step 3 Calculate your net strategic capacity. This is the number that actually matters for your OKR planning.
Example: 540 – 216 = 324 net strategic hours for the quarter
Step 4 Apply the 70-20-10 allocation rule. Distribute your net hours across your three OKRs based on priority weight:
- OKR #1 (70%): 324 × 0.70 = ~227 hours
- OKR #2 (20%): 324 × 0.20 = ~65 hours
- OKR #3 (10%): 324 × 0.10 = ~32 hours
Now look at each OKR and ask: “Is what I’m trying to achieve in this objective actually doable in that many hours?”
If the answer is no and for most founders running this calculation for the first time, it will be you’ve just saved yourself from a quarter of frustration before it starts.

Putting the AI capacity formula to Work: A real founder example
Let’s make this concrete. Jamie is a marketing consultant who just launched a productized service and is building content to generate inbound leads. She’s working roughly 42 hours per week, with a team of one part-time contractor.
Gross capacity: 42 hours × 12 weeks = 504 hours
Drain audit:
- Client calls and meetings: 8 hours/week
- Email and Slack: 10 hours/week
- Admin, invoicing, ops: 3 hours/week
- Unplanned requests: 4 hours/week (based on last quarter’s average)
- Context switching overhead: ~2 hours/week
Total drains: 27 hours/week = 64% drain rate
Net strategic capacity: 504 × (1 – 0.64) = ~181 hours
When Jamie ran this calculation, her first reaction was disbelief. She felt like she was working constantly how could she only have 181 hours of actual strategic time in a full quarter?
Then she looked at her calendar. The math was right.
OKR allocation:
- OKR #1 Build content engine (70%): 127 hours = ~10.5 hours/week
- OKR #2 Productize core service (20%): 36 hours = ~3 hours/week
- OKR #3 One strategic partnership (10%): 18 hours = ~1.5 hours/week
With this clarity, Jamie adjusted her OKR #1 KRs before the quarter started she’d originally planned 8 long-form articles but realized 5 was more realistic given the research and editing time each required. She hit 4 of them and ranked top 10 for 3 keywords by end of quarter. Her previous quarters, with no capacity planning, she’d published 2 articles and called it a bad quarter.
Same energy. Same work ethic. Better arithmetic.
Notice what happened before Jamie ran these numbers? She had OKRs written down three objectives with measurable Key Results. But she never assigned priority weights or validated them against her actual capacity. The goals looked ambitious. The time budget behind them was fantasy.
Before you calculate capacity, you need OKRs worth protecting. This guide shows you how to build them with priority allocation baked in from the start: How to Build AI-Assisted OKRs with the 12-Week
Strategic Framework With solid OKRs and validated capacity, you’re ready for the allocation rules below.
The 70-20-10 strategic allocation rule: How to distribute your capacity across OKRs
The 70-20-10 rule deserves a closer look because the instinct to spread effort evenly across objectives is strong, and it consistently produces mediocre results.
When you allocate 33% to each of three objectives, none of them gets enough concentrated investment to create momentum. You make incremental progress everywhere and breakthrough progress nowhere. It’s the quarterly equivalent of spreading butter too thin you cover the whole slice but taste nothing.
The 70-20-10 split forces a hierarchy. OKR #1 isn’t just your top priority on paper it gets more than double the strategic time of the other two combined. That concentration is what creates compounding. One objective moves fast and builds momentum. The others advance at a sustainable secondary pace.
This also changes how you protect your calendar. When you know OKR #1 gets 10.5 hours per week (using Jamie’s numbers), that becomes a non-negotiable weekly budget. If a week passes where you logged only 4 hours toward OKR #1, you know immediately that something displaced your top priority and you can diagnose it before the pattern repeats.
How to track drain rate and strategic hours with AI Tools?
AI-Assisted Team Capacity Calculation for Small Teams (2–10 People)
If you’re working with a small team, capacity planning gets more valuable and more complex.
The core formula stays the same, but you run it for each team member individually, then aggregate. Each person has their own drain profile: a customer-facing team member might have a 60% drain rate from calls and support; a developer might have a 30% drain rate but lose 2 hours daily to context switching between projects.
Team capacity process:
- Each team member estimates their weekly strategic hours (after their own drain calculation)
- Assign each person’s strategic hours to specific KRs not objectives, specific deliverables
- Identify bottlenecks before the quarter starts: which KR depends on one person who’s already at capacity?
- Redistribute or resize before committing
The most common team capacity mistake: assigning the same person to three different OKRs. Even with generous hour estimates, split attention kills strategic velocity. Where possible, let one person own one OKR deeply rather than spreading across all three.
Monthly AI capacity check-Ins: How to stay strategically calibrated mid-quarter
Capacity planning at quarter start is necessary. Capacity recalibration at weeks four and eight is what keeps the plan alive.
At each monthly check-in, run two quick calculations:
Calculation 1 Burn rate check: How many of your net strategic hours have you actually used toward each OKR? Are you on pace, ahead, or behind?
Hours used ÷ Hours planned × 100 = % of capacity deployed
If you’re at week 4 and have deployed 30% of planned OKR #1 hours but only 8% of planned OKR #2 hours OKR #2 is in trouble. You know this at week 4, not week 11.
Calculation 2 Drain drift check: Has your drain rate changed? A new client, a team member out sick, a product launch pushing more urgent tasks into your week any of these can quietly increase your drain rate by 10–15% and blow your capacity math mid-quarter.
If your drain rate has increased, adjust your KR targets accordingly. Not because you’re giving up because you’re operating on reality, not a plan that no longer matches your actual situation.
AI as your quarterly capacity planner: 3 prompts that do the heavy lifting
Once you have your capacity numbers, AI accelerates the planning conversation considerably.
Prompt 1 Feasibility Check: “I have 181 net strategic hours this quarter. My top OKR is [paste]. It gets 70% of my capacity = 127 hours over 12 weeks. Is this objective and its 3 KRs achievable in 127 hours? Break down the estimated time per KR and flag any that seem unrealistic.”
Prompt 2 Weekly Hour Budget: “Based on 127 hours for OKR #1 over 12 weeks, create a weekly hour budget by milestone. Week 1–4 should focus on [X], weeks 5–8 on [Y], weeks 9–12 on [Z].”
Prompt 3 Drain Reduction Suggestions: “My current drain rate is 64%. My biggest drains are [list]. Suggest 3 specific changes I could make this quarter to reduce my drain rate by 10% without affecting client satisfaction or team performance.”
That last prompt alone often surfaces one or two obvious optimizations an async communication policy, a meeting consolidation, a delegation opportunity that free up 3–5 strategic hours per week without heroic effort.

Ambitious quarterly goals don’t fail because you lack discipline. They fail because you never calculated whether you have the strategic hours to execute them. AI capacity planning changes that by forcing you to confront the math upfront your net strategic capacity, your drain rate, and the 70-20-10 allocation that protects your top priority. The 12-week formula, the 5 capacity drains, the realistic hour budget these aren’t productivity hacks. They’re the system that turns quarterly planning from wishful thinking into executable reality.
You already know what you want to accomplish this quarter. The question is whether you’ve allocated enough strategic hours to actually deliver it or whether you’re planning for a version of yourself that doesn’t exist. Start with one calculation: run the 12-week capacity formula, identify your drain rate, and size your OKRs to match your net strategic capacity. That single shift changes everything.
With your capacity calculated and your OKRs sized to match reality, you have everything you need to run a quarter that actually delivers.
The final piece of the system is the quarterly review where you score your results, identify what caused the gaps, and use those insights to make next quarter’s plan sharper than this one.
→Quarterly OKR Review & Course Correction with AI: A 90-Minute Framework
Or revisit the full strategic planning system this builds on:
→AI Strategic planning for entrepreneurs: Turn quarterly goals into real progress