You are getting traffic. Your affiliate site pulls 15,000 monthly visitors. Your content ranks well for decent keywords. You write helpful comparisons and detailed reviews. Last month you made $1,200 in commissions from those 15,000 visitors.
That is $0.08 per visitor. Your conversion rate sits at 1.6 percent. You need those numbers to at least double to make this business worthwhile.
The problem is not your traffic sources. It is not your content quality. It is not even your product selection. The problem is that you treat conversion optimization like a collection of random tactics instead of a systematic process.
You read that adding testimonials boosts conversion so you add some testimonials. You hear that outcome-focused headlines work better so you rewrite a few headlines. Your friend says comparison tables convert well so you create some tables. Each change might help a little or might not. You never know for sure because you change multiple things at once and never measure properly.
Three months later, your conversion rate bounces between 1.4 % and 1.8 % with no clear upward trend. You are working hard but not building a system that compounds.
I ran my affiliate business this way for almost two years. My conversion rate fluctuated randomly. Some months were great. Other months were terrible. I had no idea why because I had no framework for understanding what actually drove conversions versus what just looked like it should work.
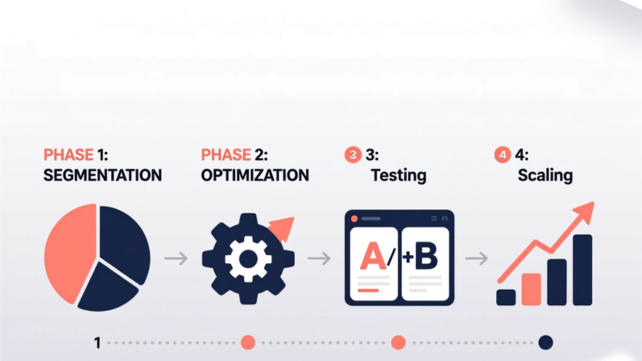
Then I built a proper CRO system. Not a list of tactics to try. A repeatable four-phase process that runs monthly: diagnose which visitor segments convert and why, optimize content and user experience for those high-value segments, personalize product recommendations to match different audience needs, and test variations systematically to validate improvements.
Within six months, my baseline conversion went from 1.4 % to 3.2 % and stayed there. More importantly, I understood exactly why certain changes worked and how to apply those learnings to new content. My CRO system became a compounding asset instead of endless trial and error.
The system works because it treats conversion optimization as a process, not a project. You are not trying to fix your conversion rate once. You are building a monthly workflow that identifies problems, implements solutions, validates results, and scales what works.
This guide gives you the complete framework used by solo affiliates and small teams to systematically improve conversion rates 50 to 150 % over six months without hiring agencies or buying expensive enterprise tools.
Why random CRO tactics fail US affiliates
Most conversion advice you read online comes from enterprise companies with massive budgets, dedicated analytics teams, and millions of monthly visitors. They can test 47 headline variations simultaneously and reach statistical significance in three days.
You are a solo founder or small team with 5,000 to 30,000 monthly visitors. You cannot run their playbook. You need a system that works with limited traffic and limited time.
The three mistakes that keep affiliates stuck
Treating CRO as one-off fixes instead of ongoing process means you optimize a page once, see some improvement, declare victory, and move on. Six months later that page’s conversion has degraded because your audience evolved, competitors improved, or products changed. You never built a system to maintain and compound improvements.
A Seattle consultant spent two months optimizing his main comparison page in early 2024. He tested headlines, restructured content, improved CTAs, and got conversion from 1.1 % to 2.3 %. Great result. Then he moved on to other projects.
By September 2024, that same page converted at 1.6 %. What happened? His highest-converting segment shifted from solo founders to small agencies based on content he published later. The page still spoke to solo founders. Competitors launched better comparison content targeting agencies. Two of his recommended products got worse reviews.
He had no system to catch these changes and respond. Without ongoing diagnosis and optimization, conversion degraded back toward his starting point.
Building a repeatable monthly workflow prevents this backsliding. You continuously monitor segment performance, refresh content as markets shift, and test new approaches. Your conversion rate trends upward over time instead of spiking briefly then fading.
Copying tactics without understanding context wastes enormous effort. You see that adding trust badges worked for some affiliate or that video testimonials boosted conversion for another site. You implement the same tactics and see minimal impact or sometimes conversion actually drops.
The tactic worked for them because it addressed a specific conversion barrier their audience had. Your audience might have completely different barriers. Trust is not your problem. Clarity about which product fits which use case is your problem. Adding trust badges does not help.
A Boulder affiliate spent three weeks adding detailed author bios, trust certifications, and security badges across his site because that advice appeared everywhere. His conversion went from 1.7 % to 1.8 %. No change.
Then he actually analyzed where visitors dropped off. The problem was not trust. Visitors believed his recommendations. They just could not figure out which of his five recommended products fit their specific situation. They left overwhelmed by choice.
He created a simple “which tool is right for you” decision tree at the top of his comparison pages. Conversion jumped to 2.9 % in 30 days. The solution was not trust signals. It was clarity and guidance.
Understanding your specific conversion barriers through proper diagnosis beats copying generic tactics every time.
Changing multiple things simultaneously without measurement creates confusion instead of clarity. You update your headline, add a comparison table, restructure your intro, and change your CTA copy all in one update. Conversion improves 15 %. Great, but which change drove the improvement?
You have no idea. Therefore, when you go to optimize another page, you do not know which element to prioritize. You might waste time on the thing that did not matter while skipping the thing that actually worked.
Worse, conversion drops despite your changes. Now you do not know which change hurt performance. You might revert all the updates including the ones that actually helped.
Systematic testing isolates variables. Change one thing. Measure the impact. Document the learning. Change the next thing. This builds a playbook of what works for your specific audience that you can apply with confidence to all your content.
What a conversion system actually does
A proper CRO system runs on a monthly cycle with four distinct phases that build on each other.
Diagnosis phase identifies who converts, who does not, and why. You segment your audience by behavior, demographics, and conversion propensity. You analyze where different segments drop off and what barriers prevent conversion. Understanding your segmentation patterns reveals which audiences deserve optimization focus and which tactics will likely work for them.
Optimization phase fixes the highest-impact conversion barriers for your priority segments. This includes page-level improvements to messaging, user experience, content structure, and calls to action. You are not optimizing for everyone. You are optimizing for the segments that drive most of your revenue.
Personalization phase shows different product recommendations and messaging to different segments. Your solopreneur visitors see affordable tools with simple onboarding. Your agency visitors see team-focused platforms with integration capabilities. Matching offers to segment needs dramatically improves conversion without creating entirely separate sites.
Testing phase validates changes through proper A/B tests before scaling them. You form hypotheses, run controlled experiments, reach statistical significance, extract learnings, and scale winners across similar content. Every test teaches you something that compounds into future decisions.
These four phases create a flywheel. Better diagnosis reveals which segments to optimize for. Better optimization improves conversion for those segments. Personalization takes proven optimizations further by matching offers to needs. Testing validates that your improvements actually work and teaches you principles to apply broadly.
Run this cycle monthly. Each iteration improves your baseline conversion rate while building your understanding of what drives your specific audience to take action.
The system works at any scale. A solo affiliate running this process 8 to 10 hours monthly can easily achieve 50 to 100 % conversion improvements over six months. Small teams can scale the same framework across more content faster.

The 4-phase AI-powered CRO system
Your conversion optimization system needs structure or it becomes random experimentation that teaches you nothing. These four phases run sequentially each month, with each phase building on the previous one.
Phase 1: Segment and diagnose (who converts, who does not, why)
Most affiliates treat all traffic the same. They write for “people interested in productivity tools” or “small business owners looking for CRM software.” This generic approach guarantees mediocre conversion across the board because different visitor types need completely different experiences.
Your 10,000 monthly visitors are not one audience. They are five to eight distinct micro-audiences with different needs, budgets, technical sophistication, and decision-making processes. Some convert at 6 %. Others convert at 0.5 %. Your job is identifying which segments drive revenue and optimizing for them first.
Start with behavioral segmentation. Use Google Analytics to identify patterns that predict conversion. High-intent visitors view three or more pages per session, spend over two minutes on comparison content, return multiple times before converting, scroll past 75 % of article length, and click through to product pages even if they do not convert immediately.
Low-intent visitors bounce from your homepage in under 30 seconds, arrive from broad informational keywords, never scroll past the first screen, and show no product research behavior.
Create audiences in GA4 based on these behavioral signals. Within two weeks, you will see dramatic conversion rate differences between segments. Your deep researchers might convert at 7.3 % while your casual browsers convert at 0.3 %.
Layer demographic and firmographic data when possible. For B2B affiliates, company size and industry matter enormously. A solo founder has completely different needs and budget than a 20-person agency. For B2C affiliates, income level and life stage drive product fit.
Tools like LinkedIn Insight Tag, Clearbit, or simple email signup surveys give you this data on portions of your audience. AI analysis can then identify patterns. Maybe visitors from companies with 5 to 20 employees spend significantly more time on integration-focused content while solo founders focus on pricing and ease-of-use content.
Add psychographic analysis through qualitative data. Export all your blog comments, email questions, survey responses, and social media mentions. Feed this into Claude or ChatGPT asking it to identify distinct psychographic segments based on pain points, motivations, and decision-making priorities.
This reveals why people buy beyond just what they buy. You might discover that one segment buys because they are overwhelmed and desperate for any solution while another segment buys to optimize an already-working system. Same product category, completely different messaging needed.
Score each segment by conversion value: conversion rate times average order value times traffic percentage. This reveals your highest-opportunity segments. A segment representing 12 % of traffic that converts at 5.1 % with high order values might be worth 3x more than your largest segment converting at 0.9 %.
A Denver affiliate discovered his third-largest segment generated more revenue than his two largest segments combined because of dramatically higher conversion rates and order values. He restructured his entire site around serving that high-value segment. Traffic stayed flat but revenue increased 180 % in 90 days.
Your diagnosis phase produces a clear picture of who your best customers are, how they behave differently from casual visitors, what specific needs and objections they have, and which segments deserve optimization priority. Identifying your high-intent buyer segments systematically transforms how you think about optimization because you stop trying to serve everyone and start excelling at serving your most valuable audiences.
Phase 2: Content and funnel optimization (fix messaging and flow)
Once you know which segments convert best, you optimize your content and user experience specifically for them. This is not about creating more content. This is about fixing what prevents your existing high-traffic pages from converting your best visitors.
Run AI-powered page audits focused on conversion elements rather than SEO elements. For each high-traffic page, analyze whether visitors can understand your value proposition in three seconds, whether your messaging aligns with your priority segment’s specific pain points, whether trust and credibility signals address common objections, whether calls-to-action appear at natural decision points with clear next-step language, and whether friction points slow down or confuse the path to conversion.
Use this prompt with Claude or ChatGPT: “Analyze this page content for conversion optimization. My priority audience is solo consultants billing $100-plus per hour who need workflow automation. Does the headline promise a specific outcome? Does the intro hook their attention in 60 words or less? Are CTAs visible and contextual? What conversion barriers exist?”
The AI identifies vague language that does not resonate, buried value propositions, missing trust elements, generic CTAs, and structural issues that create friction. A Portland affiliate ran this audit on his top five pages and discovered seven consistent problems across all of them.
His headlines promised information instead of outcomes. His intros took 150 to 200 words to state any value. Product recommendations appeared only at the bottom after most visitors had already left. He never mentioned personal experience using the tools. His CTAs were tiny text links saying “learn more” with no context. Mobile experience buried key information. He never addressed common objections his segment had.
Fixing these seven issues across five pages took about 12 hours total. No new research. No additional content. Just restructuring for conversion. Those five pages went from an average 1.3 % conversion to 2.7 % in 30 days.
Prioritize optimization by traffic times current conversion rate times improvement potential. A page getting 2,000 monthly visitors at 0.9 % conversion has more optimization opportunity than a page getting 500 visitors at 2.1 % even though the smaller page converts better.
Focus on quick wins first. Obvious improvements that require no testing include rewriting vague headlines to promise specific outcomes, cutting verbose intros by 50 to 70 %, adding personal experience and use cases, improving CTA visibility and copy, and fixing mobile usability issues.
These changes might feel small but they compound. Improving your headline, intro, and primary CTA often produces 30 to 60 % conversion lifts on pages that had solid content but poor conversion structure.
After implementing quick wins, tackle bigger structural changes. Maybe your narrative product descriptions would convert better as comparison tables. Maybe your generic recommendations need segment-specific callout boxes. Maybe your mobile experience needs a completely different layout than desktop.
A Seattle affiliate discovered through session recording analysis that mobile visitors could not easily interact with his comparison tables because they required horizontal scrolling. He rebuilt the tables as vertical comparison cards for mobile. Mobile conversion jumped from 0.8 % to 2.1 %, and mobile represented 76 % of his traffic.
Document every optimization with before and after conversion rates. This builds your playbook of what works for your audience. Over time you develop pattern recognition. You intuitively understand which content structures and messaging approaches resonate with your segments. Optimizing page-level content and CTAs becomes faster and more effective as you apply validated learnings across your site.
Phase 3: Personalization and offer matching (right offer, right segment)
Generic product recommendations underperform because they force visitors to translate your general advice into their specific situation. Most people will not do that work. They bounce and find content that speaks directly to their needs.
Personalization means showing Product A to Segment 1 and Product B to Segment 2 from your existing validated product set. You are not choosing new products to promote. You are matching the products you already promote to the visitors most likely to buy them.
Start by mapping your current product recommendations to your identified segments. For each segment, document their budget constraints, technical sophistication, primary use cases, and decision-making priorities. Then align each product to the segments it serves best based on features, pricing, complexity, and positioning.
Use AI to create this mapping: “I promote these products [list with features and prices]. I have these segments [describe each]. Create a product-to-segment fit matrix showing which products best serve which segments and why.”
The analysis reveals natural matches and mismatches. You might discover that two products you promote do not serve any of your key segments particularly well. They are mid-tier offerings too expensive for your budget-conscious segment, too limited for your power-user segment, and not specialized enough for your niche-focused segment.
An Austin affiliate dropped two poorly fitting products and added one segment-specific tool he had overlooked. His product set became more focused and his recommendations more credible. Revenue increased 34 % with less complexity.
Implementation happens at three levels depending on your technical comfort and budget. Manual segmentation creates separate landing pages for different segments. You maintain /best-CRM-software as your main SEO target but also create /best CRM for freelancers and /best CRM for agencies. You guide visitors to the appropriate version through internal links and contextual CTAs.
This approach requires no special tools and works on any platform. A Denver affiliate created three versions of his main comparison article optimized for different segments. His segmented pages converted 2.1 to 2.8 times better than his original generic page.
Basic dynamic content uses tools like ConvertFlow or Proof to swap page elements based on visitor behavior or traffic source. Your headline, featured product, or CTA copy adjusts to match the likely audience without creating entirely separate pages.
A Miami consultant shows different featured products in a callout box based on which article visitors read previously. Someone coming from his “tools for solo consultants” article sees individual-focused products. Someone from his “agency workflow” article sees team platforms. Implementation took four hours and improved conversion 41 %.
Advanced personalization platforms enable sophisticated real-time visitor profiling and testing but cost $100 to $300 monthly. Most solo affiliates should start with manual segmentation; prove the value, then upgrade to dynamic tools if ROI justifies the investment.
Measure segment-specific conversion rates for each product combination. Track, which segments convert best with which products. This reveals opportunities for improvement and validates your personalization strategy. Showing the right offer to the right visitor typically improves conversion 30 to 80 % for well-matched segments compared to generic recommendations.
Phase 4: Testing and iteration (validate, scale, and repeat)
Everything you did in phases one through three was based on analysis and best practices. Phase 4 validates that your changes actually work through proper controlled testing before you scale them across your entire site.
Most affiliates skip this step. They make changes, see conversion improve or not improve, and move on without knowing which specific elements drove results. This prevents learning that compounds over time.
Systematic testing builds a conversion playbook of validated insights specific to your audience. Each test teaches you something. Each learning applies to future content. Each win raises your baseline performance permanently.
Start with hypothesis generation. Strong hypotheses predict specific outcomes based on conversion principles and audience understanding. Use AI to generate testable hypotheses: “I run an affiliate site promoting productivity tools. My priority segment is solo consultants. Current conversion is 1.8 %. Analyze this page and suggest five high-impact test hypotheses with expected lift and reasoning.”
The AI suggests tests targeting your highest-impact elements with clear explanations of why each change should improve conversion. This beats random brainstorming.
Design each test properly. Define the single element being tested. Decide your primary metric, typically conversion rate. Calculate minimum sample size needed for statistical significance. Set test duration accounting for weekly patterns, always minimum 14 days.
Run tests without peeking at early results. The temptation to call a winner after three days when variation leads by 30 % is strong. Resist this. Give tests their full duration to reach proper significance and account for behavior variations.
A Boulder affiliate runs two to three tests monthly on his highest-traffic pages. Over six months he tested outcome-focused vs feature-focused headlines (outcome won by 27 %), comparison tables vs narrative format (tables won by 31 %), trust signal placement (mid-content won by 19 %), CTA above fold vs bottom only (above fold won by 47 % on mobile), and segment-specific vs generic intros (segment-specific won by 34 %).
Five winning tests compounded into 112 % overall conversion improvement. More importantly, he documented why each test won and applied those learnings to all new content. His conversion playbook now contains 15 validated insights that inform every page he creates.
Document every test regardless of outcome. Wins tell you what works. Losses teach you what does not work for your specific audience, preventing wasted effort trying similar approaches later. Building your systematic testing framework transforms CRO from guesswork into a compounding learning system that drives continuous improvement.
Building your CRO engine (month-by-month workflow)
Theory means nothing without execution. Your CRO system needs a practical monthly workflow that fits into a solo founder’s schedule without requiring full-time dedication.
This six-month roadmap shows you exactly what to do each month to build a conversion engine that runs on 8 to 12 hours of monthly effort while producing 50 to 150 % improvement in conversion rates.
Month 1: Set up segmentation and diagnostic infrastructure
Your first month focuses on visibility. You cannot optimize what you do not measure, and you cannot segment what you do not track.
Week 1: Install proper tracking infrastructure. Set up Google Analytics 4 if you have not already. Create custom conversion events that go beyond simple “clicked affiliate link.” Track visitors who clicked your affiliate link and stayed on the product site for 30-plus seconds, indicating genuine interest rather than accidental clicks.
Add Microsoft Clarity free heat maps and session recordings. This shows you exactly where visitors hesitate; scroll back confused, or abandon your pages. You will watch 20 to 30 sessions later this month and the patterns become obvious.
Create your first behavioral segments in GA4. Define “high-intent visitors” as people who view three or more pages and spend over 90 seconds on comparison content. Define “product researchers” as visitors who view any product-specific page. Define “converters” as people who complete your conversion events.
These audiences start collecting data immediately. Within 14 days, you will have enough information to see dramatic conversion rate differences between segments.
Week 2: Gather and analyze qualitative data. Export every blog comment from the last six months. Pull all email questions you received. Grab survey responses if you have any. Compile social media mentions and discussions about your niche.
Feed this into Claude or ChatGPT with a prompt asking it to identify distinct psychographic segments based on pain points, motivations, and language patterns. The AI will cluster your audience into three to five groups with different underlying needs.
A Portland affiliate did this with 180 customer emails and discovered three clear segments: career pivoters stressed about job security who cared about credibility over price, skill stackers optimizing existing careers who wanted time-efficient premium content, and dabblers exploring interests who only bought low-cost options. This insight completely changed her content strategy.
Week 3: Run initial traffic analysis. Pull 90 days of data from GA4 showing pages per session, time on site, conversion events, and traffic sources for your behavioral segments. Look for patterns in what high-converting visitors do differently than non-converters.
Export this data and use AI to identify clusters: “Analyze this visitor behavior data and identify distinct segments based on conversion patterns. Look for differences in page views, session duration, content types consumed, and traffic sources.”
The analysis reveals your highest-value segments and what behaviors predict conversion. Maybe your deep researchers who visit 8 to 12 pages convert at 7 % while quick deciders convert at 4 % and browsers convert at 0.3 %.
Week 4: Create your segment value matrix. For each identified segment, calculate conversion rate times average order value times traffic percentage to get a priority score. Rank segments by this score to identify your top two to three optimization targets.
Document each segment: who they are, what they need, how they behave, current conversion rate, and improvement opportunity. This becomes your strategic roadmap for the next five months.
By end of month one, you have proper tracking installed, clear audience segments identified, behavioral patterns documented, and priority targets selected. You invested 10 to 12 hours total. Your conversion rate has not improved yet, but you now understand exactly who converts and why, which makes every future optimization decision smarter.
Month 2: First optimization sprint (quick wins)
Month 2 focuses on implementing obvious improvements on your highest-traffic pages that serve your priority segments. These are not tests. These are fixing clear conversion killers that you know hurt performance.
Pick your top three pages by traffic volume that target your highest-value segment. For each page, run a complete conversion audit using the five-element framework: above-the-fold clarity, messaging-segment alignment, trust signals, CTA optimization, and friction identification.
Use AI to accelerate this: “Analyze this page content. My priority audience is solo consultants billing $100-plus per hour. Does the headline promise a specific outcome they care about? Does the intro hook their attention in under 60 words? Are CTAs visible and contextual? What conversion barriers exist?”
The AI identifies specific problems with suggested fixes. Your headline might be generic and informational when it should promise timesavings. Your intro might ramble for 200 words before stating value. Your CTAs might be buried at the bottom with vague “learn more” copy.
Compile a fix list for each page ranked by expected impact and implementation effort. Quick wins that take 30 minutes and could improve conversion 20 to 40 % go first.
Spend week one implementing headline and intro improvements across all three pages. Rewrite vague headlines to promise specific outcomes. Cut verbose intros by 60 to 70 % and front-load value. Add segment-specific language that speaks directly to your priority audience’s situation.
A Seattle affiliate changed his headline from “Best Project Management Tools Compared” to “Project Management Tools for 10-Person Agencies: Eliminate Status Update Meetings.” His intro went from 180 generic words to 50 words speaking directly to agency owners managing client work. Conversion for that segment improved 35 % from headline and intro changes alone.
Week 2 focuses on trust elements and credibility signals. Add specific personal experience stories showing you actually used the recommended products. Include use cases with concrete outcomes. Address common objections your segment has based on the qualitative data you analyzed in month one.
Week 3 improves CTA placement, visibility, and copy. Add contextual CTAs after each major section explaining what happens when visitors click. Make your primary CTA visually prominent with outcome-focused language. For mobile visitors, test sticky bottom bars with larger touch targets.
Week 4 measures results and documents learnings. Pull conversion data for the three pages you optimized. Calculate before and after conversion rates overall and by segment. Document which changes produced the biggest lifts.
An Austin affiliate spent eight hours total implementing quick wins on his top three pages. Those pages went from average 1.4 % conversion to 2.3 % within 30 days. Monthly revenue increased $950 from those three pages alone, and he built a documented playbook of what works for his audience.
Month 3: Personalization layer (segment-specific experiences)
Month 3 takes proven optimizations further by showing different content to different segments. You are not creating entirely new pages. You are adding dynamic elements that adjust based on who visits.
Choose your top one to two segments to personalize for first. Trying to personalize for five segments simultaneously spreads effort too thin. Focus on your highest-value segments where personalization will generate the most revenue lift.
Create segment-specific content modules customized headlines that speak to each segment’s specific situation, intro paragraphs addressing their unique pain points, featured product recommendations matching their needs and budget, and contextual CTAs using language that resonates with their decision-making process.
Decide your personalization approach based on budget and technical comfort. Manual segmentation creates separate URLs for different segments. You maintain your main SEO-optimized page but add /best-tools-for-freelancers and /best-tools-for-agencies. Internal links and traffic sources guide visitors to the appropriate version.
A Denver consultant created two versions of his SaaS comparison page. His freelancer version emphasized affordability, simple onboarding, and individual productivity. His agency version emphasized team features, client management, and workflow automation. He drove LinkedIn traffic to the agency version and Reddit traffic to the freelancer version.
Freelancer segment conversion went from 1.9 % to 3.2 %. Agency segment went from 2.4 % to 5.1 %. Total implementation time was 12 hours creating the two versions and setting up traffic routing.
Basic dynamic content tools like ConvertFlow allow swapping elements without separate pages. You can show different headlines or featured products based on traffic source, previous page viewed, or behavioral signals.
Implement your chosen approach in weeks one and two. Week 3 monitors performance and gathers data on segment-specific conversion rates. Week 4 analyzes results and plans expansion to additional segments or pages.
Measure conversion rate by segment before and after personalization. Calculate revenue lift directly. If personalization increases your agency segment from 2.4 % to 5.1 % conversion and that segment represents 800 monthly visitors with $180 average order value, you gained $3,888 in monthly revenue from that segment alone.
Expected lift from effective personalization typically ranges from 30 to 80 % for well-matched segments. Your highest-value segments often see the biggest improvements because you can precisely target their specific needs.
Months 4 to 6: Testing framework and continuous improvement
Your final three months shift from one-time improvements to building a systematic testing framework that drives continuous optimization.
Month 4 launches your first formal A/B tests. Choose two high-impact hypotheses from your priority list. Run them sequentially on your highest-traffic page, not simultaneously.
Test 1: Outcome-focused headline versus feature-focused headline. Your hypothesis might be “An outcome-focused headline will outperform a feature-focused headline by 20-plus percent because our consultant segment cares about time savings more than tool capabilities.”
Run the test for 14 days minimum or 100 conversions per variation. Use Google Optimize, VWO, or a simple manual approach splitting traffic between two page versions.
Test 2: Comparison table format versus narrative product descriptions. Test whether your audience prefers structured side-by-side comparisons or detailed narrative explanations with examples.
Document both tests in your conversion playbook: hypothesis, variations tested, results overall and by segment, why the winner likely outperformed, and how to apply this learning to other content.
Month 5 expands testing to mobile-specific optimizations and trust element placement. Test sticky CTAs for mobile users. Test where trust signals convert best. Test whether segment-specific examples improve conversion more than generic case studies.
Run three to four tests this month as you build velocity and confidence in your testing process. Each test should teach you something that applies broadly, not just improve one page.
Month 6 focuses on advanced tests and scaling winners. Test personalization variations. Try urgency elements if authentic and appropriate for your niche. Test different ways of presenting product comparisons.
More importantly, scale all your validated winners from months four and five across similar content. If outcome-focused headlines won by 27 % on your main page, update all your comparison pages with outcome-focused headlines. If comparison tables beat narrative by 31 %, add tables to every relevant article.
By end of month six, you have run 8 to 12 proper A/B tests, documented 5 to 8 winning variations, built a conversion playbook with validated insights, and scaled those learnings across your site. Your baseline conversion has likely improved 50 to 100 % through compounding optimizations.
Time investment and expected outcomes
This six-month roadmap requires 8 to 12 hours of focused work per month. That breaks down to 2 to 3 hours weekly, realistic for solo founders running affiliate businesses alongside other commitments.
Month 1: 10 to 12 hours setting up infrastructure and conducting analysis. Month 2: 8 to 10 hours implementing quick wins. Month 3: 10 to 12 hours building personalization. Months 4 to six: 8 to 10 hours monthly running tests and scaling winners.
Total investment over six months: 52 to 66 hours. Compare this to the ongoing cost of your current approach where you might spend 5 to 8 hours monthly creating new content that converts at 1.5 % instead of optimizing existing content to convert at 3 %.
Expected outcomes vary by starting point and niche, but most affiliates following this system see 50 to 100 % conversion improvement within six months. If you start at 1.5 % and reach 2.5 to 3 %, that represents 67 to 100 % more revenue from identical traffic.
More valuable than the immediate conversion lift is the systematic approach you build. After 6 months, you have documented playbooks, proven testing frameworks, and deep understanding of what drives your specific audience. Every new piece of content launches with 2.5 to 3 % conversion instead of 1 to 1.5 % because you apply validated learnings from day one.
AI tools for each CRO phase (US stack)
You do not need expensive enterprise platforms to run a systematic CRO process. The right combination of free and low-cost tools gets you 90 percent of the value that agencies charging $5,000 monthly provide.
Your tool stack should map to the four phases of your CRO system: segmentation and diagnosis, content optimization, personalization, and testing. Each phase needs specific capabilities but multiple phases can share tools.
Phase 1: Segmentation and diagnosis tools
Google Analytics 4 forms your foundation and costs nothing. GA4 lets you create behavioral audiences based on pages viewed, time on site, conversion events, and traffic sources. You can segment visitors in real-time and track conversion rates by segment.
Set up custom audiences for high-intent behaviors: visitors who view three or more pages, spend over two minutes on comparison content, return multiple times, or click through to product pages. Within 14 days, you will see which segments convert at 6 percent versus 0.5 %.
GA4 exploration reports let you analyze user paths, identify drop-off points, and understand how different segments navigate your site. The learning curve is steeper than Universal Analytics but the segmentation capabilities are significantly more powerful.
Microsoft Clarity provides free heatmaps, session recordings, and scroll depth analysis. Install the tracking code and within days, you can watch actual visitor sessions showing where people hesitate, get confused, or abandon pages.
Session recordings are invaluable for understanding friction. You might notice that mobile visitors struggle with horizontal scrolling tables or those visitors consistently scroll past your primary CTA without seeing it. These insights come from watching behavior, not guessing from aggregate metrics.
A Seattle affiliate discovered through Clarity recordings that visitors on his comparison page scrolled up and down repeatedly between his intro and his product recommendations at the bottom. They wanted to reference his selection criteria while reading recommendations. He added a sticky navigation bar linking to key sections. Time on page increased 40 % and conversion improved 18 %.
ChatGPT or Claude with free accounts handles qualitative analysis. Copy and paste your blog comments, email questions, and customer communications. Ask the AI to identify common themes, pain points, motivations, and psychographic segments.
This analysis would take weeks manually reviewing hundreds of messages looking for patterns. AI does it in minutes with surprising accuracy.
Hotjar costs $32 monthly and adds advanced capabilities beyond Clarity: on-page surveys to gather demographic data, feedback polls to understand visitor intent, and form analytics to identify where signup or checkout processes create friction.
The surveys are particularly valuable for gathering data you cannot infer from behavior alone. A simple “What brings you here today?” poll with three options lets visitors self-identify their segment. You can then track conversion rates by self-reported segment alongside behavioral segments.
For B2B affiliates, LinkedIn Insight Tag is free with any LinkedIn account and provides firmographic data about your visitors including company size, industry, and job function. Even without running LinkedIn ads, the pixel collects this data showing you whether your traffic comes from solo founders, SMBs, or enterprise employees.
Clearbit Reveal at $99 monthly identifies specific companies visiting your site based on IP address. For B2B affiliates earning $3,000-plus monthly, this investment makes sense because it transforms anonymous traffic into actionable firmographic data.
Total cost for phase 1 tools ranges from $0 using just GA4, Clarity, and ChatGPT to $130 monthly adding Hotjar and Clearbit for advanced capabilities.
Phase 2: Content optimization tools
Your content optimization stack focuses on page-level analysis and improvement rather than creation.
Claude or ChatGPT handles conversion audits. Feed your page content into the AI with context about your priority segment and ask it to identify conversion barriers, suggest headline improvements, evaluate CTA placement and copy, and recommend structural changes.
Use specific prompts: “Analyze this page for conversion optimization. Priority audience is agency owners with 5 to 15 employees. Does the headline promise specific outcomes? Does messaging align with agency needs? Are CTAs visible and contextual? What friction exists?”
The AI provides detailed analysis in minutes that would take hours manually. A Boulder affiliate runs AI audits on every new comparison page before publishing and on existing high-traffic pages quarterly. This systematic review catches conversion killers before they cost him revenue.
Surfer SEO or Clearscope at $49 to $99 monthly optimize content for both search and conversion. These tools analyze top-ranking pages and suggest content structure, heading hierarchy, and semantic keyword usage. While primarily SEO tools, their content scoring helps ensure your pages are comprehensive enough to build trust and answer visitor questions.
Grammarly Business at $15 monthly per user analyzes writing for clarity, engagement, and tone. The tool flags complex sentences, passive voice, and unclear phrasing that create cognitive friction for visitors trying to make decisions.
Clear writing converts better than clever writing. Grammarly helps you maintain the 8th to 10th grade reading level that converts best for most affiliate audiences while avoiding the overly casual tone that damages credibility with professional buyers.
Hemingway Editor costs $20 once or use the free web version. It highlights complex sentences, excessive adverbs, and passive voice. Your goal is readability grade 8 or lower for maximum conversion.
Many affiliates write at grade 12 to 14 level without realizing it. Complex sentences make visitors work harder to understand your points. Every bit of cognitive effort required reduces conversion slightly. Hemingway helps you simplify without dumbing down.
Figma is free and useful for mocking up page structure improvements before implementing them. You can test different layouts, CTA placements, and visual hierarchies quickly without touching your actual site code.
A Denver affiliate uses Figma to create mobile-optimized layouts before updating his pages. He can see whether his comparison tables work on small screens or need restructuring. This prevents the costly mistake of implementing changes that look great on desktop but fail on mobile where 75 % of his traffic comes from.
PageSpeed Insights from Google is free and identifies load time issues that create conversion friction. Every second of delay costs you 7 to 10 % of potential conversions. Compress images, minimize code, and enable caching based on PageSpeed recommendations.
Total cost for phase 2 tools ranges from $0 using free options to $140 monthly with paid optimization tools. Most solo affiliates do fine with the $50 to $70 monthly range.
Phase 3: Personalization tools
Personalization requires either manual effort creating separate pages or dynamic content tools that adjust pages automatically.
The manual approach costs nothing but requires creating multiple versions of key pages. A /best-CRM-software page for SEO, plus /best CRM for freelancers and /best-CRM-for-agencies for personalization. You drive traffic to the appropriate version through internal links and traffic source targeting.
This works perfectly well for solo affiliates with limited budgets. The main cost is content creation time rather than tool subscriptions.
ConvertFlow at $99 monthly enables basic dynamic content without separate pages. You can show different headlines, featured products, or CTAs based on traffic source, previous page viewed, or behavioral signals.
The tool integrates with most website platforms and lets you create personalization rules through a visual interface without coding. A typical use case: visitors from LinkedIn see B2B-focused headlines while Reddit visitors see budget-conscious language. Visitors who previously read your beginner content see entry-level product recommendations while power users see advanced tools.
Proof at $29 monthly adds social proof and personalization widgets. Beyond the notification, popups the tool is known for, you can create personalized recommendation bars that change based on visitor behavior.
For advanced personalization, Optimizely starts around $300 monthly and provides sophisticated visitor profiling, multivariate content delivery, and AI-powered optimization. This makes sense for affiliates earning $10,000-plus monthly who want maximum performance.
Most solo affiliates should start with manual segmentation at $0 cost, validate that personalization improves conversion by 30-plus %, then upgrade to ConvertFlow if the ROI justifies it.
Total cost for phase 3 ranges from $0 for manual approach to $100 monthly for dynamic content tools.
Phase 4: Testing and analytics tools
Your testing stack needs split testing capabilities, analytics to measure results, and documentation systems to build your conversion playbook.
Google Optimize is being sunset by Google but free alternatives exist. VWO starts at $99 monthly for basic A/B testing. Optimizely costs more but provides enterprise features most solo affiliates do not need.
For simple testing needs, you can manually split traffic between two page URLs and compare conversion rates in GA4. Not as elegant as dedicated testing tools but functionally equivalent for straightforward A/B tests.
The key is running tests properly with adequate sample sizes and duration, not which specific tool you use.
Pretty Links Pro at $79 yearly provides advanced affiliate link tracking and analytics. You can see which pages, which keywords, and which segments drive the most clicks and conversions. This data informs your testing priorities.
Tag your affiliate links with UTM parameters or Pretty Links tracking so you know exactly which content generates revenue versus just traffic.
Notion AI at $10 monthly helps analyze test results and extract learnings. You can paste test data and ask Notion to identify patterns, suggest hypotheses for future tests, and help document insights in your conversion playbook.
Your playbook lives in Notion or a simple Google Doc. The important part is documenting every test: hypothesis, variations, results, learnings, and applications to other content. This documentation compounds value over time as you build a library of validated insights.
Total cost for phase 4 ranges from $0 using manual approaches to $120 monthly with dedicated testing tools and analytics.
Complete stack recommendations by budget
Budget tier ($0 to $50 monthly): GA4, Microsoft Clarity, ChatGPT free, Grammarly free, Hemingway web version, manual personalization, manual testing. This stack provides 70 % of the value with zero financial cost. Your investment is time learning the tools and running the processes.
Mid-tier ($50 to $150 monthly): Add Hotjar at $32, Surfer or Clearscope at $49 to $99, Grammarly Business at $15, ConvertFlow at $99. This tier accelerates every phase without breaking the bank for affiliates earning $2,000 to $5,000 monthly.
Premium tier ($200 to $400 monthly): Add Clearbit at $99, VWO at $99, advanced analytics tools. This makes sense for affiliates earning $8,000-plus monthly who want maximum optimization velocity.
The beauty of this stack is that you can start at zero cost, validate that systematic CRO drives revenue growth, and then invest in paid tools as your income justifies it. Every tool pays for itself multiple times over through improved conversion rates.
A Portland affiliate started with the free tier, saw his conversion improve from 1.6 % to 2.8 % over three months, then upgraded to the mid-tier. The $130 monthly tool cost generated an additional $2,100 in monthly revenue through faster optimization and segmentation that is more sophisticated. ROI was clear within 30 days of upgrading.
Real conversion wins from US affiliates
Theory and frameworks matter, but what actually happens when solo founders and small teams implement this CRO system in real businesses? These case studies show the specific problems different affiliates faced and exactly how the four-phase system solved them.
Case 1: Seattle SaaS affiliate (1.8% → 4.2% conversion)
Mark ran a B2B software comparison site targeting “remote teams” with generic content about project management and collaboration tools. Traffic was solid at 18,000 monthly visitors but conversion sat stubbornly at 1.8 % generating about $3,200 monthly revenue.
His diagnosis phase revealed the problem immediately. His traffic segmented into three distinct groups: agency owners coordinating client projects (22 % of traffic, 4.1 % conversion), corporate employees researching tools for their companies (31 % of traffic, 0.6 % conversion with no purchasing authority), and solo founders managing small teams (47 % of traffic, 1.9 % conversion).
The corporate employees drove nearly a third of his traffic but almost never converted because they were not decision makers. His generic “remote teams” positioning attracted researchers without buying power.
His agency segment converted best but his content spoke to everyone generically instead of addressing their specific workflow challenges around client communication, project handoffs, and team coordination.
Month 1: Mark created behavioral segments in GA4 and ran psychographic analysis on 200 email questions and blog comments. The agency owners consistently mentioned stress around client status updates, team members working across multiple projects, and the need for client portals.
Month 2: He rewrote his top five pages specifically for agency owners. New headlines promised outcomes like “Eliminate Weekly Status Update Meetings” and “Give Clients Real-Time Project Visibility.” His intros addressed agency-specific pain points. His product recommendations shifted to tools with strong client collaboration features.
His featured products changed from generic collaboration platforms to agency-focused project management with built-in client portals. His examples shifted from “remote teams staying aligned” to “agencies managing eight simultaneous client projects with a 12-person team.”
Conversion for the agency segment jumped from 4.1 %t to 6.8 % within 30 days. That segment represented 22 % of traffic but now generated 48 % of revenue.
Month 3: Mark implemented basic personalization using separate landing pages. LinkedIn traffic went to agency-focused content. Organic search traffic from generic keywords hit a gateway page asking “Are you an agency, corporate team, or small business?” with links to appropriate content.
Agency segment conversion reached 7.9 %. Solo founder segment improved from 1.9 % to 3.2 % with their own optimized pages.
Months 4 to six: Testing validated specific tactics. Outcome-focused headlines beat feature-focused by 31%. Comparison tables showing client collaboration features specifically outperformed narrative descriptions by 44 %. Trust signals mentioning agency client counts (“manage 15-plus clients simultaneously”) converted 28 % better than generic testimonials.
By month 6, overall conversion reached 4.2 % with the corporate employee segment mostly excluded through better targeting. Monthly revenue increased from $3,200 to $7,600. Same traffic volume, dramatically better conversion through segmentation and optimization.
Mark’s key learning: “I was trying to serve everyone and converting nobody well. Focusing on my best segment and excluding bad-fit traffic felt risky but doubled my revenue. The segment I thought was my biggest opportunity (largest traffic share) was actually my lowest value. The smaller agency segment generated 3x more revenue per visitor.”
Case 2: Portland e-learning affiliate (0.9% → 3.1% conversion)
Jessica promoted online courses and educational platforms. She got decent traffic at 12,000 monthly visitors but conversion was terrible at 0.9 %. Her revenue averaged $950 monthly, barely covering her tool costs and time investment.
Her diagnosis uncovered a structural problem rather than an audience problem. Her segments converted at reasonable rates when they found the right recommendations: career changers at 2.8 %, skill builders at 3.4 %, and hobbyists at 0.4 %.
The issue was that her comparison pages buried key information visitors needed to make decisions. People bounced at 68 % rate because they could not quickly determine which courses fit their experience level, time commitment, or learning goals.
Month 1: Session recordings revealed the pattern. Visitors landed on her “Best Data Science Courses” comparison, scrolled through 2,000 words of content, then left without clicking anything. Comments and emails showed the problem: “I need to know if this is for beginners or if I need Python experience first.” “How many hours per week does this require?” “Is this self-paced or scheduled?”
Her content answered these questions eventually but made visitors hunt for critical information. That friction killed conversion.
Month 2: Jessica restructured her top three comparison pages around decision-making needs rather than comprehensive reviews. She added quick-reference sections at the top showing experience level required, time commitment, learning format, and price for each recommended course.
She created comparison tables with columns for “Best for Complete Beginners,” “Best for Career Changers with Some Experience,” and “Best for Professionals Upskilling.” Visitors could immediately identify which recommendation fit them.
Her detailed reviews still existed further down the page for people who wanted more information, but the key decision factors appeared in the first screen.
Bounce rate dropped from 68 % to 41 %. Conversion jumped from 0.9 % to 2.1 % in 30 days. She had not changed her recommendations, just made it easier to find the right one.
Month 3: Personalization took this further. She created segment-specific entry points. Her “best data science courses for career changers” page featured 2 to 3 courses perfect for people transitioning from other fields. Her “advanced data science courses” page targeted experienced analysts wanting to level up specific skills.
Internal linking and traffic routing guided visitors to the appropriate page based on which introductory articles they read first.
Career changer segment conversion reached 4.8 %. Skill builder segment hit 3.9 %. She stopped optimizing for hobbyists entirely since they represented 34 % of traffic but only 6 % of revenue at 0.4 % conversion.
Months 4 to 6: Testing focused on how to present course information. Tables beat narrative by 51 %. Specific time commitments (“4 hours weekly for 12 weeks”) converted 33 % better than vague descriptions (“self-paced”). Including instructor credentials in the comparison-improved trust enough to lift conversion 22 %.
Final conversion rate: 3.1 % overall, with career changers at 4.8 % and skill builders at 3.9 %. Monthly revenue increased from $950 to $3,200. Jessica’s time investment was 10 hours monthly running her CRO system.
Her key learning: “My content was actually good. The problem was presentation and structure. Visitors needed answers to specific questions before they would trust my recommendations. Once I made that information immediately visible, conversion tripled. I spent two years trying to write better content when I should have been restructuring how I presented it.”
Case 3: Austin productivity tools affiliate (1.3% → 3.7% conversion)
David promoted productivity software and workflow automation tools. His traffic came primarily from organic search at 14,000 monthly visitors. Conversion was 1.3 % generating $2,100 monthly.
His problem was different from the first two cases. His segmentation was fine. His content structure was decent. His issue was that he promoted products based on commission rates rather than what his audience actually wanted.
Diagnosis revealed that his highest-converting segment was solo consultants and freelancers billing $100-plus hourly. They represented 28 % of traffic and converted at 3.2 % when they found tools that fit their needs.
However, David featured products with the best affiliate terms, not the best fit for consultants. He promoted general productivity platforms that included team features consultants never needed. His recommendations optimized for his commission, not their outcomes.
Month 1: David mapped his current products to his segments. Three of his seven promoted tools had weak product-segment fit. They paid 30 % commissions but solved problems his consultants did not have while costing more than necessary.
He identified consultant-specific alternatives: time tracking with client billing integration, proposal automation, client portal tools, and focused productivity apps without wasted team collaboration features.
Month 2: He swapped out the three poor-fit products for better-aligned alternatives even though two paid lower commissions (20 % vs 30 %). His product recommendations now matched what consultants actually needed based on the pain points they described in emails and comments.
His featured tools shifted from “powerful team collaboration” to “reclaim 8 to 10 hours weekly on admin work” and “automate client communication without hiring an assistant.”
Consultant segment conversion jumped from 3.2 % to 5.4 % immediately. The lower commission rates were offset by higher conversion. His revenue actually increased because he sold more at 20 % than he did at 30 %.
Month 3: David built personalization showing consultants their specialized tools while showing small team traffic the collaborative platforms. His organic traffic hit generic landing pages that quickly routed visitors to segment-appropriate recommendations.
Months 4 to 6: Testing validated his product-market fit hypothesis. Consultant-specific use cases (“track billable hours and generate invoices automatically”) converted 64 % better than generic productivity promises. Product positioning around “avoid hiring an assistant” resonated strongly, improving conversion 41 % over “boost your productivity.”
Final conversion: 3.7 % overall with consultants at 6.1 %. Monthly revenue increased from $2,100 to $5,300 despite promoting some products with lower commission rates.
David’s key learning: “I was optimizing for the wrong thing. I wanted high commissions so I pushed expensive enterprise tools to solo freelancers. When I switched to actually solving their problems with appropriate tools, conversion nearly doubled and I made much more money on lower commission rates. Product-audience fit matters infinitely more than commission percentage.”
Common patterns across winning implementations
These three affiliates started with different problems but followed the same systematic process. They diagnosed their actual conversion barriers through segmentation and analysis instead of guessing. They optimized for their highest-value segments instead of trying to serve everyone equally. They tested specific hypotheses and documented learnings instead of implementing random tactics.
Most importantly, they treated CRO as a system that runs monthly rather than a one-time project. Mark still runs his four-phase cycle. Jessica still tests variations. David still validates new products against his segment needs. Their conversion rates continue improving because they have repeatable processes, not just lucky wins.
Common conversion mistakes AI helps you avoid
Running a CRO system prevents most optimization mistakes through systematic diagnosis and testing. However, several traps still catch affiliates even when they have good processes. Understanding these pitfalls helps you avoid wasting months on approaches that cannot work.
Mistake 1: Optimizing for vanity metrics instead of revenue
Many affiliates celebrate improvements in metrics that do not actually drive income. Time on page increased 40 %. Bounce rate dropped 15 points. Pages per session went up 25 %. These sound impressive but mean nothing if conversion rate and revenue stay flat.
Visitors spending more time on your page might indicate engagement. Alternatively, it might indicate confusion as they hunt for the information they need. Lower bounce rate could mean better content, or it could mean visitors click around lost before giving up.
Focus ruthlessly on metrics that predict revenue: conversion rate by segment, revenue per visitor, click-through rate on affiliate links that actually convert (not just clicks but clicks that result in purchases), and average order value.
Use AI to identify which metrics actually correlate with revenue for your specific site. Export three to six months of data showing various engagement metrics alongside conversion and revenue data. Ask ChatGPT or Claude: “Analyze these metrics and identify which ones actually predict revenue. Look for patterns where improvements in specific metrics consistently lead to revenue increases.”
The AI might reveal that scroll depth past 60 % correlates strongly with conversion while time on page does not. On the other hand, that return visitors convert at 4 x the rate of new visitors, making return visit rate a key metric to optimize.
A Seattle affiliate discovered that his “engaged visitors” metric (viewing 3-plus pages, spending 2-plus minutes) did not predict conversion at all. Those visitors were reading his educational content but never buying. Meanwhile, visitors who viewed exactly two pages (landing page plus one product-specific page) converted at 6.2 %. His optimization focus shifted completely based on this insight.
Define your north star metric: the one number that best predicts business health. For most affiliates, this is revenue per visitor or conversion rate for your highest-value segment. Every optimization decision should move that metric.
When you test headline variations, compare them on conversion rate not time on page. When you restructure content, measure affiliate link clicks that convert not total link clicks. This discipline prevents celebrating meaningless improvements while missing real problems.
Mistake 2: Testing without statistical significance or proper duration
Enthusiasm kills good testing. Your variation leads by 35 % after three days and 180 visitors. You declare victory, implement the winner, and move on. Two weeks later conversion is back to baseline. What happened?
You stopped the test too early. With small sample sizes, random variation creates misleading results. Your variation might have randomly gotten more high-intent visitors in those first three days. Over two weeks the advantage disappears as traffic normalizes.
Proper testing requires minimum sample sizes and durations. Run every test for at least 14 days regardless of early results. This captures weekly traffic patterns. Weekend traffic often differs from weekday traffic in quality and conversion propensity.
Reach minimum 100 conversions per variation before making decisions. With baseline 2 percent conversion, you need 5,000 visitors per variation or 10,000 total. If you only get 2,000 weekly visitors, your test needs five weeks to reach significance.
Use AI to calculate required sample sizes before starting tests. Prompt: “I want to detect a 25 % improvement in conversion rate from a baseline of 2.1 % with 95 % confidence. My page gets 1,800 monthly visitors. How long should I run this test and what minimum conversions do I need?”
The AI does the statistical math showing you need 4,200 visitors per variation and 88 conversions per variation, meaning a two-month test duration with your traffic levels.
This discipline prevents false positives where you implement changes that do not actually work. It also prevents false negatives where you abandon winning variations because you checked results too early when they were still behind.
A Boulder affiliate ran 12 tests in his first six months of optimization. He stopped eight of them within 5 to 7 days when he saw clear winners. Only three of those eight actually maintained their advantage when he checked again at 14 days. He had made incorrect decisions 63 % of the time by peeking early.
After implementing proper test duration discipline, his next 12 tests produced reliable results. He only implemented winners that held up through full testing periods, and his documented learnings actually applied to other content.
Set calendar reminders for when tests should end. Do not check detailed results until that date. You can monitor high-level “test is running correctly” metrics but not conversion rates by variation.
Mistake 3: Optimizing low-traffic pages that cannot generate meaningful results
Your enthusiasm for CRO leads you to optimize every page on your site. You spend four hours improving a comparison article that gets 180 monthly visitors. Even if you double conversion from 1.5 % to 3 %, you gain 2.7 conversions monthly.
At $60 average commission, that is $162 additional monthly revenue for four hours of work. That is $40.50 per hour, which might be acceptable. However, you could have spent those same four hours optimizing a page with 2,000 monthly visitors producing $2,700 additional revenue, or $675 per hour.
Prioritize optimization effort by impact potential: traffic volume times current conversion rate times improvement potential. A page getting 3,000 visitors at 0.8 % conversion has more opportunity than a page getting 400 visitors at 2.1 % even though the smaller page converts better.
Set minimum traffic thresholds. Only run dedicated optimization sprints on pages getting 500-plus monthly visitors. Only run A/B tests on pages getting 1,000-plus monthly visitors. Smaller pages get winning tactics from your high-traffic tests applied automatically without individual optimization.
Use AI to create your optimization priority list. Export traffic and conversion data for all your pages. Prompt: “Rank these pages by optimization priority based on traffic volume, current conversion rate, and potential for improvement. Assume I can improve conversion 30 to 60 percent with focused effort.”
The AI calculation shows you exactly which pages deserve attention first and which should wait until you have exhausted higher-value opportunities.
A Denver affiliate realized he had wasted 30 hours optimizing 12 low-traffic pages that collectively generated $340 additional monthly revenue. If he had spent that same 30 hours on his top three pages, he would have generated $2,100 additional revenue based on their traffic levels.
This does not mean ignoring small pages entirely. Apply learnings from your high-traffic optimization to low-traffic pages in batches. If outcome-focused headlines won your tests on main pages, update all your headlines including low-traffic pages. Nevertheless, do not run dedicated optimization projects or tests on pages that cannot move your revenue meaningfully.
Mistake 4: Ignoring mobile experience in optimization and testing
Seventy to eighty percent of affiliate traffic comes from mobile devices for most niches. Yet many affiliates optimize primarily on desktop because that is where they work. Your beautiful comparison table looks perfect on your 27-inch monitor but requires horizontal scrolling on phones, destroying the user experience for 75 % of visitors.
Every optimization must consider mobile first since that is where most revenue comes from. Your headline improvement might work great on desktop but are truncated on mobile. Your sticky CTA might be perfectly sized for mouse clicks but too small for thumb taps. Your navigation improvements might add clarity on desktop but create confusion on small screens.
Check mobile performance separately in all your analytics. If you are overall, conversion is 2.4 %, segment by device. You might discover desktop converts at 3.8 % while mobile converts at 1.9 %. The mobile experience is your biggest conversion opportunity.
Use mobile-specific tools for analysis. Microsoft Clarity shows mobile session recordings separately. You can watch how phone users actually interact with your content, seeing exactly where they struggle.
A Portland affiliate noticed through mobile recordings that visitors repeatedly tapped his comparison table trying to expand rows for more information. The table appeared interactive but was just a static image on mobile. He rebuilt it with expandable sections that opened on tap. Mobile conversion improved 52 p% from that single fix.
Test mobile and desktop experiences separately when traffic allows. A variation that wins on desktop might lose on mobile or vice versa. Create mobile-specific variations for tests addressing mobile-specific issues like touch target size, sticky elements, and scroll behavior.
Set up mobile-specific conversion funnels in GA4. Track where mobile users drop off differently than desktop users. The friction points are often completely different between devices.
Prioritize mobile fixes over desktop improvements unless your analytics show unusual desktop-heavy traffic. For most affiliates, a 20 % mobile conversion improvement delivers 3 to 4 times more revenue than a 20 % desktop improvement simply because of traffic distribution.
Mistake 5: Copying competitor tactics without understanding context
Your competitor added a comparison table and their traffic grew. You add comparison tables everywhere. Your competitor uses long-form 5,000-word articles so you expand all your content. Your competitor positions products around affordability so you emphasize low prices.
These tactics might work for them because of their specific audience, traffic sources, and positioning. Your audience might need completely different approaches.
Two affiliates in the same niche can have dramatically different conversion optimization needs based on their traffic composition. One gets most traffic from high-intent commercial keywords and converts at 4.5 % with short, focused product comparisons. Another gets educational traffic from informational keywords and needs long-form content that educates before recommending, converting at 2.1 %.
If affiliate two copies affiliate one’s short comparison format, conversion drops because their traffic is not ready for immediate recommendations. If affiliate one copies affiliate two’s educational approach, conversion drops because their visitors already know what they want and just need quick guidance.
Use AI to analyze whether competitor tactics fit your specific context. Document your traffic sources, primary keywords, audience segments, and conversion barriers. Then evaluate competitor tactics: “My traffic comes primarily from [sources] searching [keyword types]. My audience segments are [descriptions]. A competitor uses [tactic]. Would this likely improve my conversion given my specific context or would it hurt performance?”
The AI analyzes fit based on your situation rather than just copying what appears to work elsewhere.
Test any borrowed tactic properly before scaling it. Just because it works for a competitor does not mean it works for you. Run a proper A/B test. Measure the impact. Only implement widely if you validate the improvement in your specific environment.
A Miami affiliate spent two months implementing a competitor’s entire content structure including long FAQ sections, detailed feature breakdowns, and video embeds. His conversion dropped from 2.3 % to 1.8 %. The competitor’s approach worked for their audience but not his.
After reverting the changes and running his own systematic diagnosis, he discovered his audience wanted quick decision support, not comprehensive education. His conversion recovered and eventually reached 3.1 % using completely different tactics than his competitor.
Learn principles from competitors, not specific tactics. If a competitor succeeds with strong segment focus, the principle is “serve a specific audience deeply.” How you implement that for your different audience will look different from their implementation.
Study competitors to understand market dynamics and validate opportunities. However, always filter tactics through your own audience data, conversion barriers, and systematic testing before implementing.
Conversion optimization stops being overwhelming when you treat it as a system instead of a collection of random tactics. The four-phase framework gives you a repeatable monthly process: diagnose which segments convert and why, optimize content and experience for high-value visitors, personalize offers to match different audience needs, and test variations to validate improvements.
This systematic approach produces compounding results that one-off fixes cannot match. Each month you understand your audience better. Each test teaches you principles that apply to all your content. Each optimization raises your baseline conversion rate permanently instead of creating temporary spikes that fade.
The difference between struggling affiliates and successful ones is rarely traffic volume or content quality. It is whether they have a system for continuously improving conversion rates or whether they rely on guesswork and hope.
You already have the traffic. You already have content that ranks. The fastest path to doubling your affiliate revenue is not generating more visitors. It is converting the visitors you already get at twice the rate through systematic optimization.
Start with diagnosis this week. Set up your GA4 segments. Install Microsoft Clarity. Export your qualitative data and run AI analysis. Within 48 hours you will know which segments drive your revenue and which conversion barriers prevent growth.
This understanding changes everything. You stop optimizing for everyone and start excelling at serving your most valuable audiences. You stop implementing random tactics and start fixing specific problems your data reveals. You stop guessing about what works and start testing hypotheses based on conversion principles.
The six-month roadmap requires 8 to 12 hours of focused work monthly. That investment produces 50 to 150 % conversion improvement for most affiliates who follow the system consistently. If you currently make $2,500 monthly at 1.5 % conversion and reach 3 % through systematic optimization, you make $5,000 monthly from identical traffic.
More valuable than immediate revenue growth is the systematic capability you build. After six months you have documented playbooks showing exactly what works for your audience. You have proven testing frameworks that validate improvements before scaling them. You have deep understanding of conversion dynamics in your specific niche.
Every new piece of content you create launches with 2.5 to 3.5 % conversion instead of 1 to 1.5% because you apply validated learnings from day one. Your baseline performance improves permanently, not just temporarily.
The tools you need cost between $0 and $150 monthly depending on your budget and scale. The free tier provides 70 % of the value using GA4, Microsoft Clarity, and ChatGPT. Paid tools accelerate the process but are not required to see meaningful results.
Your CRO system becomes a competitive advantage that compounds over time. Competitors can copy your content topics and keyword targets. They cannot copy your systematic understanding of what drives your specific audience to convert. That knowledge lives in your documented playbooks and testing results, built through months of disciplined optimization.
The hardest part is starting. Breaking from the cycle of creating more content and instead optimizing what you have feels uncomfortable initially. Revenue growth from new content is immediate and visible. Revenue growth from conversion optimization takes 30 to 60 days to show results.
But conversion improvements compound while content creation does not. Publishing 10 new articles might generate short-term traffic spikes that fade. Improving your conversion rate 50 % affects every article, every visitor, every month going forward.
Begin with the highest-leverage starting point: understanding which of your visitors actually convert and why. Audience segmentation reveals the opportunities that matter most and prevents wasting effort on tactics that cannot work for your specific traffic.
Identify your high-intent buyer segments this week using the systematic framework. That single step transforms how you think about optimization because you finally understand who deserves your focus and what problems you need to solve for them.
Your conversion rate is not a fixed characteristic of your niche or your content quality. It is a function of how well you understand your audience and how systematically you optimize their experience. The affiliates converting at 4 to 6 % in competitive niches are not luckier or more talented. They have better systems.
Build your system starting today. Six months from now you will have doubled your revenue from existing traffic while developing the strategic capability to maintain and extend that advantage indefinitely.